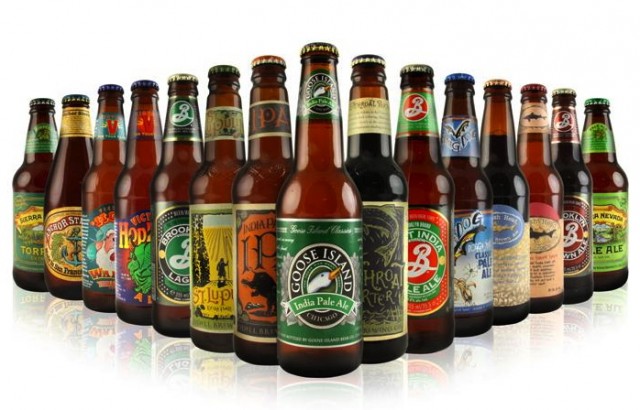
This project focused on cleaning, pre-processing, and exploratory analysis of raw countries breweries data. The data was stored in csv file and read into POSTGRESQL database, where it was analyzed.


Visualizing and building dashboard on data science salaries in Microsoft PowerBI

Welcome to my Tableau dashboard showcasing the projects I have worked on. This interactive platform offers a comprehensive view of my data visualization projects, demonstrating my expertise in transforming complex datasets into visually appealing and insightful visualizations. Through a combination of charts, graph and interactive features, this dashboard highlights the key metrics, trends and patterns of each project, providing holistic understanding of my analytical skills and the value I can bring to data-driven decision making.
